
Data usage disaggregation breaks total consumption down into meaningful categories, revealing what’s really driving energy use so you can target opportunities with confidence.
Why total consumption isn’t enough
Total energy use only tells half the story
A single consumption figure shows you how much energy a home uses, but not what it’s being used for. Without that detail, it’s difficult to target interventions, model behaviour accurately or identify the real opportunities for change.
Turning raw feeds into smarter data
Our property data disaggregation breaks 30-minute energy data down into distinct usage categories, powered by advanced algorithms refined through three years of consumer feedback.
The result is a clear view of where energy really goes, ready to inform research, planning and product decisions. We break energy down into meaningful categories.
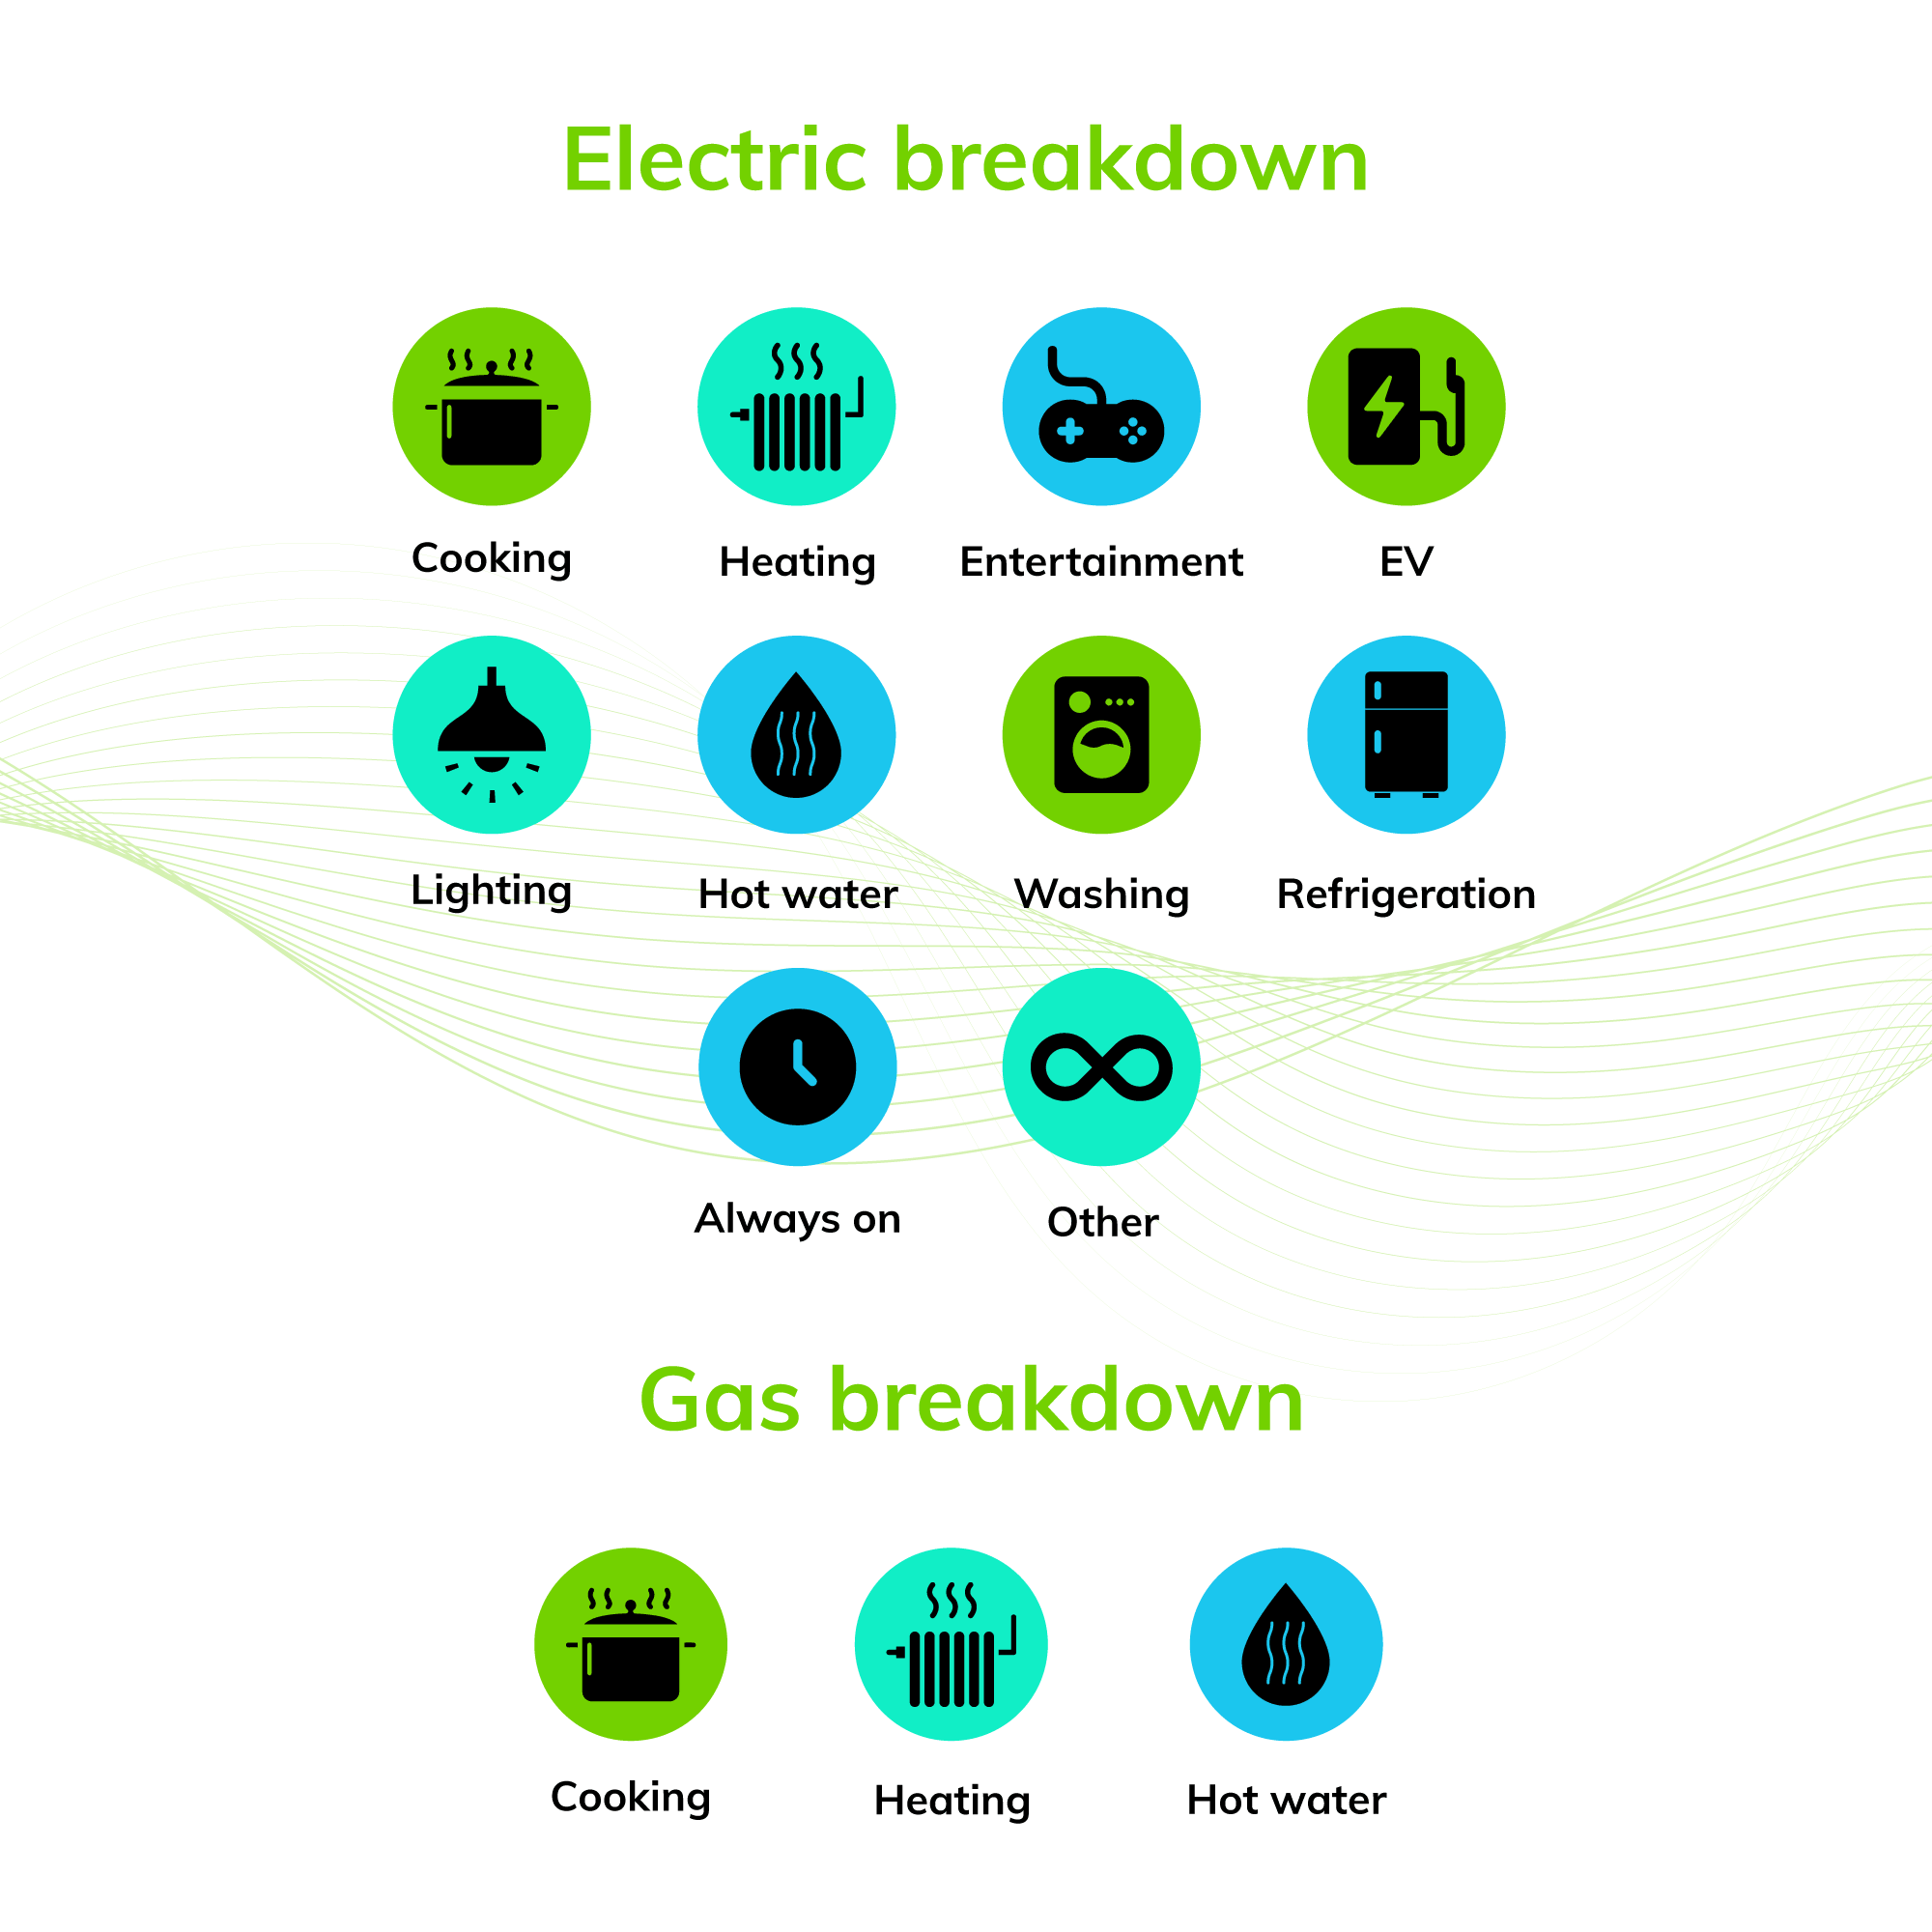
Cooking, heating, entertainment, EV charging, hot water, lighting, refrigeration, washing, always-on devices and more.
Cooking, heating and hot water.
By highlighting a home’s most energy-hungry areas, disaggregation helps you move beyond the numbers and identify clear, evidence-based opportunities for improvements and upgrades.
How it works
From smart meter feeds to actionable insights
Disaggregation sits at the top of Chameleon’s data offering, building on whole-home and enhanced data to deliver our most comprehensive dataset. Each step is designed to turn continuous energy readings into clear, usable insight.
Disaggregated insight can be combined with enhanced home profiling, including property type, occupancy and low carbon technology adoption, for even richer segmentation.
Trusted by housing and energy leaders
pioneers in smart energy since
devices delivered to UK homes
UK homes already reached
Frequently asked questions
Disaggregation breaks a home’s total energy consumption down into distinct, meaningful categories, revealing what energy is actually being used for rather than just how much is consumed. By separating usage by fuel type and by area of the home, it highlights a property’s most energy-hungry activities, so you can move beyond a single figure and see where the real opportunities lie.
For electricity, we break usage into categories including cooking, heating, entertainment, EV charging, hot water, lighting, refrigeration, washing, always-on devices and more. For gas, we cover cooking, heating and hot water. This category-level detail gives you a genuine picture of where energy goes, ready to inform research, planning and product decisions.
Our disaggregation is powered by advanced algorithms refined through three years of consumer feedback, applied to granular 30-minute smart meter data. This combination of real-world refinement and high-resolution input means you get a dependable, evidence-based breakdown you can confidently build decisions on.
Technologies like EVs and heat pumps distort traditional usage patterns, making whole-home figures misleading. Disaggregation isolates specific loads such as EV charging and electric heating, so you can see exactly how these technologies contribute to demand, rather than having their impact hidden within a single consumption total.
Yes. Disaggregation sits at the top of Chameleon’s data offering and can be combined with enhanced home profiling, including property type, occupancy and low carbon technology adoption. This lets you segment your analysis far more richly, understanding not just what energy is used for, but which kinds of homes are driving each pattern.
Behaviour-change programmes need specificity to be effective. A whole-home figure can’t tell a household or a provider where to focus, but a category breakdown pinpoints the biggest energy drivers, revealing clear, evidence-based opportunities for improvements and upgrades and helping interventions land where they matter most.